


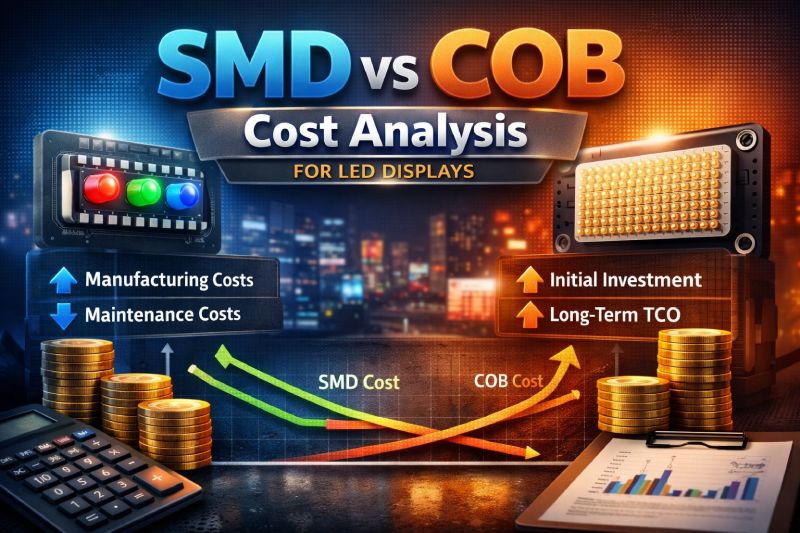
In today’s fine-pitch LED display market, performance alone no longer determines purchasing decisions. Procurement teams, integrators, and project owners increasingly evaluate displays through a financial lens.
A detailed SMD vs COB cost analysis reveals that the real difference between these two packaging technologies extends beyond unit price—it involves manufacturing economics, yield rates, installation risk, maintenance cycles, and long-term total cost of ownership (TCO).
This guide delivers a structured financial comparison designed specifically for LED display applications.
Manufacturing cost forms the foundation of any LED display pricing model. To understand the financial differences between SMD and COB technologies, it is necessary to examine how each packaging method structures material input, process complexity, and production efficiency.
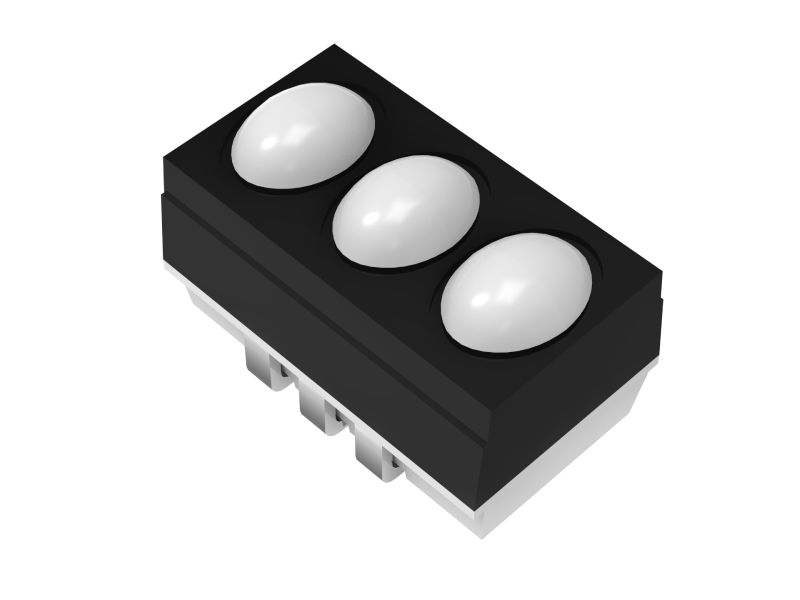
SMD (Surface-Mounted Device) LEDs are individually packaged components mounted onto PCB boards via SMT processes.
However, at sub-1.0mm pitch, SMT placement density dramatically increases cycle time and defect probability.
COB (Chip-on-Board) technology eliminates individual packaging and bonds bare LED dies directly to PCB substrates.
But:
While manufacturing cost establishes a baseline, pixel pitch dramatically changes the economic equation. As LED density increases, process tolerance, alignment precision, and defect sensitivity begin to affect overall cost scalability.
| Pixel Pitch | Relative Cost Advantage |
| P2.0 – P4.0 | SMD |
| P1.2 – P1.8 | Competitive |
| < P1.0 | COB potential advantage |
As pitch decreases:
Important: Modern micro-SMD packaging has narrowed the fine-pitch gap significantly.
Beyond factory production, cost performance is also affected by installation workflow and structural durability. Handling risk, labor requirements, and module replacement complexity all contribute to real-world project expenses.
For rental environments or public-interaction installations, COB can reduce hidden rework costs.
Initial procurement price does not fully represent long-term financial exposure. A proper SMD vs COB cost analysis must extend into maintenance frequency, repair cost, and operational lifespan to reveal true ownership economics.
| Cost Factor | SMD | COB |
| Initial purchase | Lower | Higher |
| Installation | Similar | Slightly higher |
| Annual maintenance | Moderate | Lower |
| Pixel repair frequency | Higher | Lower |
| Surface damage risk | Moderate | Low |
Scenario: 100m² indoor P1.2 display, 5-year operation
Projected 5-Year Trend:
Actual results depend heavily on:
Yield rate is often overlooked in surface-level comparisons, yet it is one of the most decisive cost variables in fine-pitch LED production. Small differences in defect rate can dramatically shift cost-per-pixel outcomes.
If:
COB cost advantage disappears quickly.
But if:
COB yield stabilizes above 99%
Then ultra-fine pitch scaling becomes economically favorable.
Therefore:
Manufacturing maturity outweighs packaging theory.
In large-scale LED projects, pricing consistency and supplier diversity play a strategic role. Evaluating cost without considering supply chain resilience can introduce hidden financial risk.
For global integrators, pricing predictability matters as much as unit cost.
Every LED display project carries operational risk. Packaging architecture influences exposure to damage, repair difficulty, and long-term reliability, all of which translate into cost implications.
| Risk Factor | SMD | COB |
| SMT misalignment | Moderate | Low |
| Encapsulation inconsistency | Low | Moderate |
| Surface physical damage | Moderate | Low |
| Repair complexity | Low | Moderate |
Cost decisions must include risk exposure probability.
Return on investment varies depending on application context and project duration. Rather than evaluating SMD and COB in isolation, financial modeling should align technology choice with expected usage patterns.
When evaluating ROI:
Choose SMD if:
Choose COB if:
To address common procurement concerns and recurring evaluation questions, the following section clarifies key cost-related uncertainties surrounding SMD and COB technologies.
Not necessarily. COB may reduce long-term maintenance cost, but initial procurement is typically higher.
For mainstream pitches (P1.2–P2.5), SMD often provides stronger short-term ROI.
Below P1.0mm, provided manufacturing yield is optimized.
COB generally offers better surface durability, potentially reducing cumulative repair frequency.
A professional SMD vs COB cost analysis shows that cost efficiency is contextual, not absolute.
Key evaluation criteria:
The correct question is not:
“Which technology is cheaper?”
But rather:
“Which packaging strategy minimizes total lifecycle cost for this specific LED display application?”
For decision-makers in fine-pitch LED projects, financial modeling should always accompany technical evaluation.