


AV integrators using the D-Tools platform recorded sales growth in the first half of 2026. But the results varied widely between companies. Median sales rose 14% from the same period in 2025. At the same time, some integrators reported strong growth, while others saw significant declines.
The changes extended beyond sales. D-Tools also found shifts in average contract values. The share of integrators with average contracts between $25,000 and $50,000 declined. The shares below $10,000 and above $50,000 increased. Contract and proposal volumes also rose, while closing rates remained broadly stable.
These figures point to a clear divide in integrator performance. They also show changes in contract-value distribution and business activity. The sections below look at each of these trends in more detail.
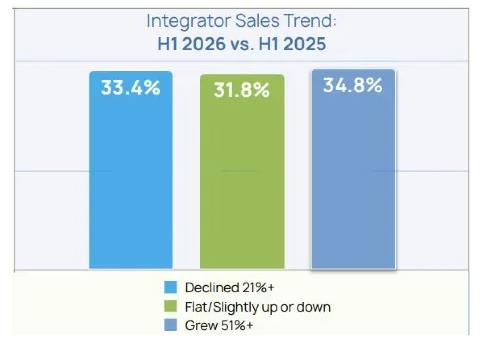
D-Tools reported a 14% year-over-year increase in median sales among the integrators in its dataset. This figure describes the middle value in the sample. It does not mean that every integrator increased sales by 14%.
The differences between companies were much larger.
Some integrators achieved rapid growth. In fact, 34.8% increased sales by at least 51%. At the other end of the range, 33.4% saw sales fall by 21% or more.
D-Tools said the split appeared across companies of different sizes. It was not limited to one particular group.
The data show a clear gap in sales performance. However, the report does not identify the specific factors behind it. The figures alone, for example, do not show whether company size, customer mix, or business type was the main driver.
D-Tools also found changes in the distribution of average contract values.
The number of integrators with average contracts between $25,000 and $50,000 fell by 16.1%. Meanwhile, the shares of integrators with average contracts below $10,000 and above $50,000 both increased.
The wording of this finding is important.
The 16.1% decline refers to integrators whose average contract value was between $25,000 and $50,000. It does not mean that the number of projects in this price range fell by 16.1%.
It also does not show that the total value of those projects declined by the same percentage.
The same distinction applies to the increase in the share of integrators with average contracts above $50,000. The data do not show that the number or total value of projects above $50,000 increased.
Instead, the report shows a shift in the distribution of integrators by average contract value. The $25,000–$50,000 range contracted, while the shares at both ends increased.
Business activity provides another perspective on the sales figures.
Contracts signed per integrator increased 17% in the first half of 2026. Proposal output rose 19%. Closing rates, however, remained essentially flat.
This suggests that higher sales were accompanied by more business activity rather than a major improvement in conversion rates.
Integrators submitted more proposals and signed more contracts. At the same time, their closing rates changed little. The data therefore point to a larger volume of sales opportunities moving through the pipeline.
The report does not explain why proposal volumes increased. It therefore does not establish whether customer demand, sales strategies, competition, or other factors drove the change.
The scope of the dataset is important when reading these findings.
D-Tools based the report on aggregated transaction data from more than 1,500 active integration companies using D-Tools Cloud. The year-over-year analysis focused on companies that used the platform in both 2025 and 2026. This allowed D-Tools to compare the same user cohort across the two periods.
The report therefore reflects the performance of D-Tools platform users. It is not an independent survey of the entire AV integration market.
This distinction matters when interpreting the results. The 14% increase in median sales and the changes in integrator performance describe the companies covered by the dataset. They should not be treated as direct measures of overall market growth or market size.
D-Tools’ midyear data show two developments at the same time. Median sales among the integrators in its dataset increased 14%. But individual company performance varied sharply.
The distribution of average contract values also changed. The $25,000–$50,000 range contracted, while the shares below $10,000 and above $50,000 increased. Meanwhile, contracts signed per integrator rose 17% and proposal output increased 19%. Closing rates remained broadly stable.
The main takeaway is therefore not simply that sales increased. The data show sales growth alongside a clear divide in integrator performance, as well as changes in contract values and business volume.
Because the report uses D-Tools platform data, its findings provide a snapshot of this particular group of integrators. A broader view of the AV integration market would require data from a wider range of companies and sources.

