Brightness is an important factor when selecting LEDs and planning an LED display. The right brightness depends on where the display will be installed and how it will be used. For indoor applications, excessive brightness can waste energy and cause visual discomfort. For outdoor applications, insufficient brightness can make content difficult to see under strong ambient light.
Before finalizing an LED display design, it is therefore useful to estimate the brightness the display can achieve. This helps determine whether the selected LEDs and display configuration are likely to meet the project’s brightness requirements.
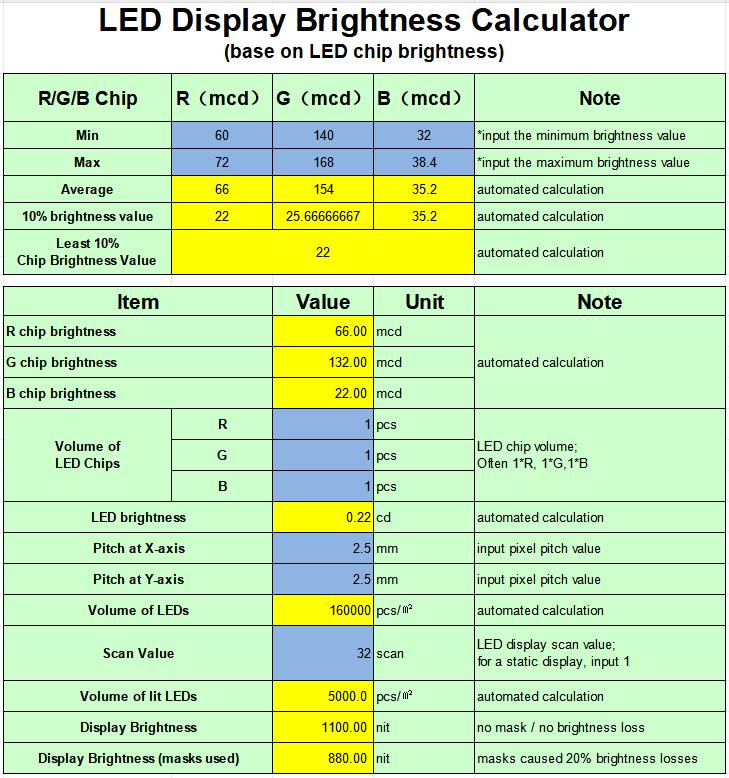
An LED display brightness calculator can help with this estimate. By using the RGB LED chip brightness specifications, pixel pitch, and scan ratio, you can calculate an estimated display brightness before building the screen.
In this article, we’ll use Kinglight 2020-BB-S1 LED as an example and walk through how to use the calculator, understand its results, and account for factors that may affect actual display brightness.
Before opening the calculator, prepare the following information for the LED display you want to evaluate:
In the main worksheet, enter data only in the designated input cells. The spreadsheet calculates the intermediate values and estimated display brightness automatically.
Use the brightness ranges shown on the product label. For Kinglight 2020-BB-S1, the example specifications are:
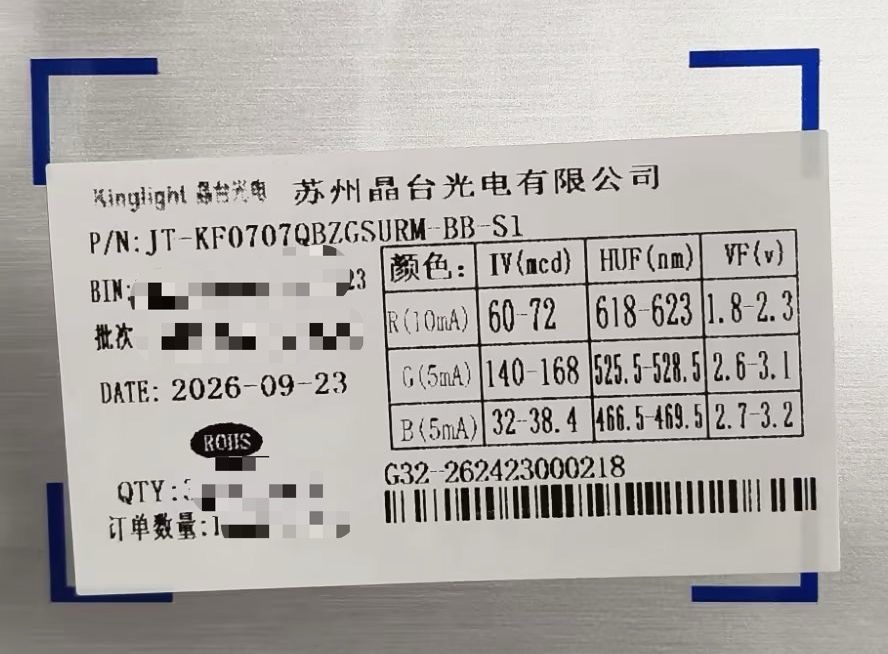
Enter the minimum and maximum values in the corresponding RGB fields. The calculator first finds the average brightness for each color:
Red: (60 + 72) / 2 = 66 mcd
Green: (140 + 168) / 2 = 154 mcd
Blue: (32 + 38.4) / 2 = 35.2 mcd
For this estimation method, the calculator uses an approximate RGB chip brightness ratio of 3:6:1 as a reference. Divide each average brightness by the corresponding ratio:
Red: 66 / 3 = 22 mcd
Green: 154 / 6 ≈ 25.67 mcd
Blue: 35.2 / 1 = 35.2 mcd
The lowest normalized value is 22 mcd, so the calculator uses it as the reference brightness value. This is a calculation reference based on the assumed RGB ratio; it is not a statistical “lowest 10%” value.
Using the reference value and the 3:6:1 ratio, the estimated brightness values for the RGB chips are:
Red: 22 × 3 = 66 mcd
Green: 22 × 6 = 132 mcd
Blue: 22 × 1 = 22 mcd
Assuming each pixel uses one red, one green, and one blue chip, the combined brightness used in this example is:
66 + 132 + 22 = 220 mcd
If a pixel uses a different number of chips for any color, update the chip counts in the calculator. The combined value depends on the actual RGB chip configuration.
Pixel pitch determines how many pixels fit into one square meter. For a P2.5 display, both the horizontal and vertical pixel pitch are 2.5 mm:
(1000 / 2.5) × (1000 / 2.5) = 160,000 pixels/m²
With a 1/32 scan ratio, one thirty-second of the pixels are lit in each scan interval. The estimated number of pixels lit at a time per square meter is therefore:
160,000 / 32 = 5,000 pixels/m²
Enter 2.5 mm for both pixel-pitch fields and 32 for the scan value. The calculator determines the pixel count and the number of pixels lit at a time.
The example uses an estimated combined RGB LED brightness of 220 mcd and 5,000 pixels lit at a time per square meter:
220 mcd × 5,000 pixels/m² = 1,100,000 mcd/m²
Because 1 cd equals 1,000 mcd, this is equivalent to:
1,100,000 / 1,000 = 1,100 cd/m², or 1,100 nits
The estimated brightness for this P2.5 / 1/32-scan example is 1,100 nits before any allowance for optical losses.
For LED displays equipped with masks, the mask can reduce the amount of light emitted toward the viewer. Based on practical experience, a brightness loss of approximately 20% can be used as a reference for estimation. The actual loss may vary depending on the mask design and display configuration.
Using the estimated brightness of 1,100 nits, the adjusted brightness is:
1,100 × (1 − 20%) = 880 nits
Note that this adjustment applies to LED displays equipped with masks. Kinglight 2020-BB-S1 is a high-contrast LED typically used for indoor applications, where a mask is generally not required. Therefore, the 20% reduction is included here to illustrate how to account for mask-related brightness loss when applicable.
The calculator provides a useful estimate of LED display brightness based on LED chip specifications and display parameters. However, the calculated value may differ from the actual brightness of a finished display. To understand why, we need to consider three factors that can affect the accuracy of the estimate.
The calculator uses a standard 3:6:1 red-to-green-to-blue chip brightness ratio as a reference for estimating white-light output around a D65 color temperature of 6,500 K. Actual RGB brightness ratios vary by LED model and design, so this ratio is an estimation assumption rather than a universal rule.
A smaller pixel pitch means more pixels fit into each square meter. Under otherwise comparable conditions, this can increase the estimated brightness per unit area. The scan ratio also affects how many pixels are lit at the same time: for example, a 1/4-scan display lights one quarter of its pixels per scan interval, while a 1/8-scan display lights one eighth.
The workbook also includes a supplementary worksheet for working in the opposite direction. Instead of estimating display brightness from LED chip specifications, it starts with a target display brightness, pixel pitch, scan ratio, and an assumed light-loss factor to estimate the required RGB LED chip brightness. This can be useful when evaluating whether a proposed LED specification may meet a display brightness target.
The estimation method can provide a useful reference for evaluating LED display brightness. To see how the calculated result compares with actual product specifications, let’s look at the Kinglight 2020-BB-S1 LED.
According to the product page, the 2020-BB-S1 can achieve a display brightness of 1,000 nits on a P3 / 32-scan LED display. Our calculation estimates 1,100 nits for a P2.5 / 32-scan display. Although the two figures are not directly equivalent because they refer to different pixel pitches, they are reasonably close. The result also follows the expected trend: at the same scan ratio and under otherwise comparable conditions, a smaller pixel pitch means more pixels per square meter and can therefore result in higher estimated display brightness.
This comparison suggests that the method can provide a useful preliminary estimate. However, the calculated value may still differ from the actual brightness of a finished LED display. Three factors can contribute to this difference:
For these reasons, treat the calculated result as a preliminary engineering estimate rather than a guaranteed brightness value. For projects with specific brightness requirements, verify the final display brightness through actual measurements.